


Abstract
Protein anabolism in response to feeding may be impaired with aging. To determine if this could contribute to muscle loss, we studied fed-state metabolic responses in healthy, non-sarcopenic elderly women.
Whole-body [3H]glucose and protein ([13C]leucine) kinetics were measured, and muscle protein fractional synthesis rate ([2H5]phenylalanine) and signaling events were assessed from vastus lateralis biopsies in eight elderly (73 ± 3 years) and eight young women (24 ± 1 years), using a simulated fed steady-state clamp.
Both groups had similar muscle and lean body mass indices and activity level. During insulin, glucose (8 mmol/L), and amino acid (AA; 2× fasting) infusions, serum insulin was lower in the elderly women and C-peptide increased less. Glucose uptake was stimulated, and production suppressed similarly. Suppression of whole-body protein breakdown was less in the elderly women, leading to lower AA infusion rates, oxidation, and net positive protein balance, but differences were not present when adjusted for serum insulin. Whole-body protein synthesis and muscle protein fractional synthesis rate increased similarly. Similar increases in phosphorylated AktSer473, PRAS40Thr246, FoxO3aThr32, and rpS6Ser240/244 indicated no alterations in insulin/nutrient signaling with aging.
Both whole-body and muscle fed-state protein anabolic responses were preserved, as was insulin sensitivity of glucose metabolism, in active, healthy elderly women. This is consistent with other factors such as sedentarity, low protein intake, and concurrent diseases, being responsible for the sarcopenia of aging.
MAINTENANCE of muscle mass is an important component of healthy aging, as its loss is associated with frailty and disability (1). Muscle protein mass results from the net balance between protein synthesis and breakdown, both acutely regulated by insulin and amino acid (AA) supply. The negative muscle protein balance of the fasted state becomes positive when AA are available and insulin is elevated upon feeding (2), along with changes at the whole-body level (3,4). An impaired anabolic response to feeding stimuli could therefore be responsible for gradual muscle loss over time.
We (5) and others (6) found a blunted whole-body anabolic response to hyperinsulinemia with maintenance of AA availability, concurrent with the insulin resistance of glucose metabolism commonly seen in older persons. These findings were corroborated by a lack of stimulation of leg muscle protein synthesis by postprandial insulin levels in the elderly participants (7) but normalization of responses at supraphysiological insulin levels (8). Consistently, activation of the insulin signaling pathway, assessed by phosphorylation of AktSer473, was increased more at supraphysiological than postprandial insulin concentrations, without changes in eukaryotic initiation factor 4E (eIF4E)–binding protein 1 (4E-BP1)Thr37/46 phosphorylation (8), a substrate of mammalian target of rapamycin complex 1 (mTORC1). Lesser suppression of leg protein breakdown was reported with minimal hyperinsulinemia (∼90 pmol/L) without change in synthesis, resulting in the inability of older participants to switch to positive protein balance (9).
In addition to insulin resistance, aging may also cause resistance to AA anabolic stimuli. Blunted stimulation of leg muscle synthesis by a low dose of oral essential AA (EAA, 7 g) was reported (10) but normalized with higher doses (2,11,12) or intravenous hyperaminoacidemia (13). Contrasting studies revealed lesser myofibrillar and sarcoplasmic protein synthesis responses after ingestion of 10 and 20 g of EAA during a pancreatic clamp (14) and blunted mixed muscle and mitochondrial protein synthesis during hyperaminoacidemia with hyperinsulinemia in older participants (15). Both studies reported defects, although inconsistently, in specific steps in the insulin signaling and AA sensing pathways by which mTORC1 regulates protein synthesis.
This study quantified both glucose and protein isotopic kinetics in response to steady-state fed conditions during a hyperinsulinemic, hyperglycemic, and hyperaminoacidemic clamp at peak physiologic postprandial levels (16), which allows testing simultaneously for insulin sensitivity using isotopic methods. The hyperglycemic component was included to simulate mixed-meal postprandial physiology, including its effect on endogenous insulin secretion, which may differ with aging. Possible defects in muscle protein synthesis with aging were postulated to be associated with alterations in insulin signaling and the AA sensing pathway of mTORC1.
METHODS
Participants
Healthy young and elderly women (eight per group) were recruited through advertisements. The elderly women were community dwelling and independent in instrumental daily activities. Participants underwent health screening, as detailed (17), and provided written informed consent. None of the older women were receiving hormone replacement therapy, and all young women were studied during their follicular phase. The institutional Human Research Ethics Board approved this protocol. Body composition was assessed by dual-energy X-ray absorptiometry (Lunar Prodigy Advance; GE Healthcare, Madison, WI). For 6 days prior to the tracer study, participants received an inpatient isoenergetic and isoproteic diet, based on diet history and composed of a liquid formula (Ensure; Abbott Laboratory, St. Laurent, QC, Canada) with bran cereal and milk breakfast. Total energy expenditure and physical activity level were estimated from triaxial accelerometry (RT3; Triaxial Research Tracker; Stay Healthy, Inc., Monrovia, CA) prior to or after the study, for at least four consecutive days of usual physical activity.
Tracer Studies
Glucose and protein kinetics were studied postabsorptively and during the hyperinsulinemic, hyperglycemic, and hyperaminoacidemic clamp using primed, constant infusions of [3-3H]glucose and L-[1-13C]leucine as described in (16) but with insulin infusion rate at 0.4 mU/kg lean body mass (LBM)·min. (see Supplementary Material). Muscle protein synthesis was assessed with L-[ring-2H5]phenylalanine (Cambridge Isotope Laboratories, Inc., Andover, MA), given as a primed (0.89 mg/kg), continuous (0.026 mg/kg·min) infusion started 300 minutes before insulin. The target glucose of 8 mmol/L and total branched chain-AA of 700 μmol/L were established from peak responses of eight young participants after a 714 kcal liquid mixed-meal with 17% of energy as protein (30 g).
Blood was sampled at frequent intervals for substrate, hormone, and isotopic enrichment determinations at steady states. Expired air was collected (Becton Dickinson Vacutainer Systems, Franklin Lakes, NJ) for 13CO2 enrichment and indirect calorimetry was performed for 20 minutes during postaborptive and clamp steady states. Glucose turnover was calculated according to (18). Leucine kinetics were calculated using plasma α-ketoisocaproic acid (α-KIC) enrichment (19) as described (16).
Prior to and 2 hours after start of the insulin, ∼100 mg vastus lateralis muscle biopsies were obtained with a Bergstrom needle under sterile precautions and local anesthesia (Xylocaine 2%; Astra-Zeneca Canada Inc., Mississauga, ON, Canada). Muscle samples were immediately frozen in liquid nitrogen and stored at −80°C until analysis.
Assays
Glucose was measured by glucose oxidase (GM7 Micro-Stat; Analox Instruments USA, Lunenberg, MA); insulin, glucagon, and C-peptide by radioimmunoassay (Linco, St. Charles, MO); and glucose specific activity as previously described (17). Plasma total branched chain-AA were measured by fluorometry during clamp (17) and individual AA by high-performance liquid chromatography (System Gold; Beckman Coulter Instruments, Palo Alto, CA). Plasma α-13C-KIC enrichment was analyzed by gas chromatography-mass spectrometry (5988A; Hewlett-Packard, Palo Alto, CA). Expired air was analyzed for 13CO2 enrichment by IRMS on a Micromass 903D (Vacuum Generators, Winsforce, UK).
Muscle-free and protein-bound phenylalanine enrichment was analyzed as n-propyl ester heptafluorobutyramide derivatives by negative chemical ionization GC-MS (5975C; Agilent, St-Laurent, QC, Canada) (20), by monitoring the ion mass to charge ratio 383 and 388, corresponding to unlabeled and labeled ions, respectively (20). Protein-bound phenylalanine low enrichment was determined as the 388/386 ratio, using the standard curve approach (21). Mixed-muscle protein fractional synthesis rate was determined as the rate of increase in protein-bound phenylalanine enrichment over that of the intracellular free pool (20).
Immunoblotting
Muscle samples were homogenized and centrifuged as described (16). Equal amounts of supernatant protein (40 μg, measured by Bradford assay) were loaded onto 8% or 15% gels, electrophoresed by sodium dodecyl sulfate–polyacrylamide gel electrophoresis, and transferred to polyvinylidene fluoride membranes (GE Healthcare, Baie d’Urfé, QC, Canada). After blocking, membranes were incubated with phospho-specific primary antibodies overnight at 4°C, then washed three times in Tris buffered saline with Tween, and subsequently incubated with secondary antibody (GE Healthcare) in Tris buffered saline with Tween containing 5% nonfat dried milk for 1 hour at room temperature. Signals were detected by enhanced chemiluminescence reagents (GE Healthcare) and analyzed using ChemiDOC XRS system (Bio-Rad, Mississauga, ON, Canada). After detection of the phospho-specific signal, the antibodies were stripped off the membrane. The membranes were washed, blocked, and reprobed with primary antibodies that recognized the proteins irrespective of their phosphorylation state. The densities of phosphorylated signals were normalized to total protein levels. Primary antibodies were from Cell Signaling Technology (Beverly, MA).
Statistical Analyses
Participant characteristics and steady-state baseline and fed-state clamp data were compared between groups by independent t tests. Responses to the clamp were analyzed using two-factor repeated measures analysis of variance, with age and fed-state clamp as main factors, to test for within-and between-subject effects. A significant age-by-clamp interaction indicates an aging effect on responses to the fed-state clamp. Covariate analysis was used to adjust the changes in glucose and protein kinetics for the different increase in serum insulin between groups. Results are presented as means ± SEM. Analyses were performed using SPSS 15.0 (SPSS Inc., Chicago, IL).
RESULTS
Subject Characteristics
The elderly women had similar mean body weights to young, but because of their shorter stature, their mean body mass index was significantly higher (Table 1). Fat mass and waist circumference were higher and LBM was lower in the elderly women, but when normalized for height, LBM and appendicular muscle mass were not different. Energy and protein intakes and resting and total energy expenditures per LBM were not different. All the elderly women were glucose tolerant (2 hours after 75 g oral glucose, 6.48 ± 0.31 mmol/L).
Subject Characteristics
| Young | Elderly | |
| n | 8 | 8 |
| Age (y) | 23.6 ± 1.1 | 73.0 ± 2.7** |
| Height (cm) | 171.0 ± 2.2 | 157.5 ± 2.9** |
| Weight (kg) | 62.0 ± 3.6 | 60.8 ± 3.5 |
| Body mass index (kg/m2) | 21.1 ± 0.7 | 24.4 ± 0.9* |
| Fat mass (kg) | 17.1 ± 1.9 | 23.5 ± 2.2* |
| %Body fat | 27.2 ± 1.5 | 38.1 ± 1.9** |
| LBM (kg) | 42.3 ± 1.8 | 35.3 ± 1.6* |
| LBM index (kg/m2) | 14.5 ± 0.3 | 14.2 ± 0.3 |
| Appendicular muscle mass index (kg/m2) | 6.6 ± 0.2 | 6.2 ± 0.2 |
| Waist circumference (cm) | 78 ± 2 | 86 ± 1** |
| Energy intake (kcal/kg LBM·d) | 50.9 ± 1.3 | 48.8 ± 1.0 |
| Protein intake (g/kg LBMd) | 1.97 ± 0.05 | 1.94 ± 0.05 |
| Resting energy expenditure (kcal/kg LBM·d) | 34.8 ± 1.1 | 33.6 ± 0.9 |
| Total energy expenditure (kcal/kg LBM·d) | 50.2 ± 0.8 | 49.0 ± 1.4 |
| PAL | 1.41 ± 0.06 | 1.49 ± 0.05 |
Notes: Physical activity level (PAL): Total (TEE)/resting energy expenditure; for TEE and PAL, n = 6 in young. LBM = lean body mass
**p < .01, *p < .05 versus young, by independent t tests.
Substrate and Hormone Concentrations
Postabsorptive plasma glucose, leucine, and total AA concentrations were slightly elevated in the elderly women, and all were clamped at the same levels (Table 2). Fasting free fatty acid concentrations were higher but decreased to similar concentrations as the young. Fasting insulin did not differ between groups but increased less, as did C-peptide, in the elderly women during clamp, despite receiving the same dose per LBM as the young.
Substrate and Hormone Responses to the Hyperinsulinemic, Hyperglycemic, and Hyperaminoacidemic Clamp
| Young | Elderly | ANOVA, Age × Clamp (p value) | |
| Plasma glucose (mmol/L) | |||
| PA | 4.99 ± 0.07 | 5.26 ± 0.04* | |
| Clamp | 7.86 ± 0.05 | 7.97 ± 0.02 | .084 |
| Plasma leucine (μmol/L) | |||
| PA | 93 ± 5 | 110 ± 5* | |
| Clamp | 248 ± 14 | 273 ± 12 | .626 |
| Plasma BCAA (μmol/L) | |||
| PA | 298 ± 15 | 343 ± 14 | |
| Clamp | 640 ± 29 | 694 ± 26 | .795 |
| Plasma total EAA (μmol/L) | |||
| PA | 790 ± 30 | 851 ± 26 | |
| Clamp | 1,520 ± 68 | 1,570 ± 44 | .899 |
| Plasma total AA (μmol/L) | |||
| PA | 2,263 ± 69 | 2,506 ± 39* | |
| Clamp | 3,259 ± 146 | 3,469 ± 71 | .836 |
| Serum FFA (μmol/L) | |||
| PA | 518 ± 44 | 690 ± 54* | |
| Clamp | 37 ± 7 | 48 ± 7 | .027 |
| Serum insulin (pmol/L) | |||
| PA | 49 ± 3 | 50 ± 4 | |
| Clamp | 405 ± 43 | 300 ± 15* | .029 |
| Serum C-peptide (pmol/L) | |||
| PA | 416 ± 18 | 507 ± 57 | |
| Clamp | 2,228±161 | 1,796 ± 195 | .034 |
| Plasma glucagon (pmol/L) | |||
| PA | 13.6 ± 1.0 | 13.4 ± 1.4 | |
| Clamp | 13.1 ± 1.0 | 13.8 ± 1.6 | .296 |
Notes: AA = amino acids; ANOVA = analysis of variance; BCAA = branched-chain AA = EAA: essential AA; FFA = free fatty acids; LBM = lean body mass; PA = postabsorptive.
*p < .05 versus young, by independent t tests.
Glucose Kinetics
Postabsorptive glucose kinetics were similar (Table 3). Clamp endogenous glucose production was suppressed and glucose uptake stimulated equally, concurrent with similar glucose infusion rates. Adjusting for serum insulin did not affect changes in glucose kinetics, consistent with the similar insulin sensitivity indexes.
Glucose and Leucine Kinetics in Response to the Hyperinsulinemic, Hyperglycemic, and Hyperaminoacidemic Clamp
| Young | Elderly | ANOVA, Age × Clamp (p value) | |
| Glucose kinetics (mg/kg LBM·min) | |||
| Rate of appearance | |||
| PA | 3.2 ± 0.1 | 3.3 ± 0.2 | |
| Clamp | 1.1 ± 0.1 | 0.8 ± 0.2 | .214 |
| Rate of disposal | |||
| PA | 3.4 ± 0.1 | 3.3 ± 0.1 | |
| Clamp | 8.2 ± 0.5 | 8.2 ± 0.4 | .964 |
| Infusion rate | |||
| Clamp | 7.2 ± 0.6 | 7.3 ± 0.6 | na |
| Clearance rate (mL/kg LBM·min) | |||
| PA | 3.8 ± 0.1 | 3.5 ± 0.2 | |
| Clamp | 5.8 ± 0.4 | 5.7 ± 0.3 | .842 |
| Insulin sensitivity index (mg/kg LBM·min)/(pmol/L) | |||
| Clamp | 0.019 ± 0.002 | 0.025 ± 0.003 | na |
| Leucine kinetics (μmol/kg LBM·min) | |||
| Total Ra | |||
| PA | 2.48 ± 0.10 | 2.30 ± 0.06 | |
| Clamp | 4.68 ± 0.16 | 4.14 ± 0.13* | .061 |
| Oxidation | |||
| PA | 0.45 ± 0.02 | 0.36 ± 0.02* | |
| Clamp | 2.21 ± 0.15 | 1.74 ± 0.10* | .046 |
| Infusion rate | |||
| Clamp | 2.98 ± 0.14 | 2.33 ± 0.08* | |
| Endogenous Ra | |||
| PA | 2.48 ± 0.10 | 2.30 ± 0.06 | |
| Clamp | 1.70 ± 0.10 | 1.80 ± 0.06 | .015 |
| Non-oxidative Rd | |||
| PA | 2.04 ± 0.08 | 1.94 ± 0.05 | |
| Clamp | 2.47 ± 0.11 | 2.38 ± 0.07 | .908 |
| Net balance | |||
| PA | −0.45 ± 0.02 | −0.36 ± 0.02* | |
| Clamp | 0.77 ± 0.09 | 0.58 ± 0.04 | .012 |
Notes: Responses analyzed by repeated measures ANOVA. ANOVA = analysis of variance; LBM = lean body mass; na = not applicable; PA = postabsorptive; Ra = rate of appearance; Rd = rate of disappearance.
*p < .05 versus young, by independent t tests, at a given period.
Leucine Kinetics
Postabsorptive net leucine balance was less negative in the elderly women due to lower leucine oxidation rates (Table 3). Clamp nonoxidative leucine disposal (surrogate of protein synthesis) was equally stimulated in both groups, but endogenous rate of appearance (protein breakdown) was less suppressed in the elderly women. Consequently, the AA infusion rates (shown for leucine) required for maintaining the same circulating levels were lower in the elderly women. Because stimulation of protein synthesis was the same, the increase in net balance from postabsorptive to fed state, net anabolism, was less in the elderly women. These effects on breakdown suppression and net anabolism were no longer significant when adjusting for plasma insulin (Figure 1).
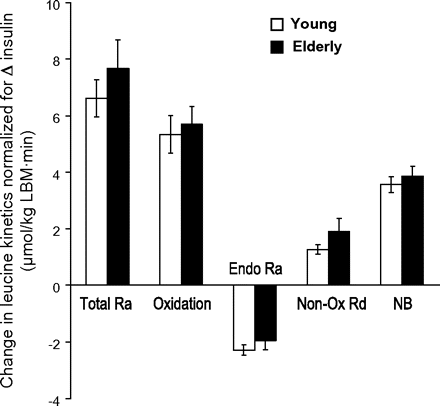
Whole-body leucine kinetics responses to the fed-state clamp. Changes in leucine kinetics, normalized to the change in plasma insulin, from postabsorptive (white bars) to fed-state clamp (black bars). Total Ra: total rate of appearance (flux); Endo Ra: endogenous rate of appearance (protein breakdown); Non-Ox Rd: non-oxidative rate of disposal (protein synthesis); Net balance: synthesis-breakdown.
Muscle Protein Synthesis
Postabsorptive mixed-muscle protein fractional synthesis rate did not differ between groups and increased similarly during the clamp (Figure 2).
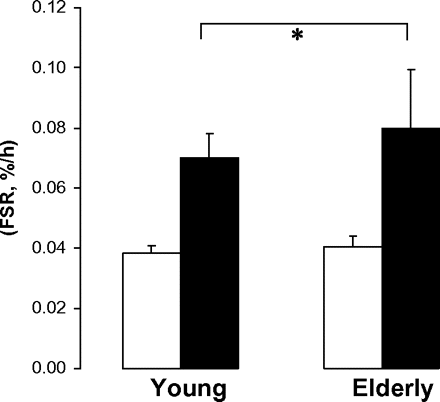
Skeletal mixed-muscle protein fractional synthesis rate during postaborptive state and fed-state clamp. Repeated measures analysis of variance: *Clamp effect, p < .01. No significant age effect or age-by-clamp interaction. White bars: postabsorptive; black bars: fed-state clamp.
Signaling Proteins
The postabsorptive phosphorylation state of the signaling proteins measured was not different between groups. Phosphorylation of AktSer473 and its substrate proline-rich Akt substrate of 40 kDa (PRAS40) at Thr246 increased threefold in both groups at 120 minutes of the clamp (Figure 3A and B). A less pronounced, similar, increment in phosphorylation of Forkhead box protein FoxO3aThr32 occurred (Figure 3C). There was a general stimulation effect of the clamp on the phosphorylation of rpS6Ser240/244 (Figure 4A) and of insulin receptor substrate (IRS)-1Ser636/639 (Figure 4B), not different between groups. Phosphorylation of 4E-BP1 on both Ser65 (Figure 4C) and Thr70 (Figure 4D) was somewhat increased by the clamp, with Thr70 moreso in the young (significant age-by-clamp interaction). 4E-BP1Thr37/46 phosphorylation did not change (not shown).
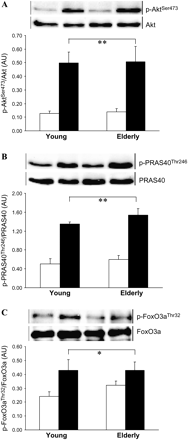
Phosphorylation of Akt, PRAS40, and FoxO3a in skeletal muscle of young and elderly women in response to fed-state clamp. (A) Phosphorylated AktSer473/total Akt (n = 6 young, n = 5 elderly). (B) Phosphorylated PRAS40Thr246/total PRAS40 (n = 5 young, n = 5 elderly). (C) Phophorylated FoxO3aThr32/FoxO3a (n = 6 young, n = 5 elderly). Graphs are mean ± SEM, with representative blots. Repeated measures analysis of variance: Clamp effect, **p < .001, *p < 0.05. No significant age effect or age-by-clamp interaction. AU: arbitrary densitometric units. White bars: postabsorptive; black bars: fed-state clamp.
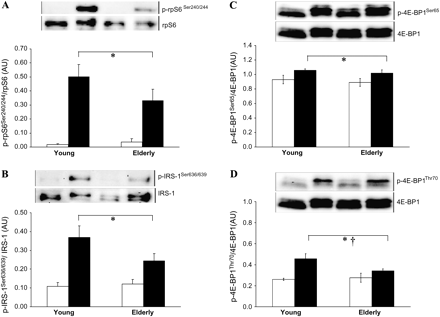
Phosphorylation of rpS6, IRS-1, and 4E-BP1 in skeletal muscle of young and elderly women in response to fed-state clamp. (A) Phosphorylated rpS6Ser240/244/total rpS6 (n = 5 young, n = 5 elderly). (B) Phosphorylated IRS-1Ser636/639/total IRS-1 (n = 5 young, n = 4 elderly). (C) Phosphorylated 4E-BP1Ser65 (n = 4 young, n = 4 elderly) and (D) phosphorylated 4E-BP1Ser70 (n = 5 young, n =5 elderly), both as ratio to total 4E-BP1. Graphs are mean ± SEM, with representative blots. Repeated measures analysis of variance: Clamp effect, **p = .001, *p < .05; †age-by-clamp interaction, p < .05; no significant age effect. AU: arbitrary densitometric units. White bars: postabsorptive; black bars: fed-state clamp.
DISCUSSION
This study used a hyperinsulinemic clamp protocol to simulate a fed-steady state with sustained physiologically relevant postprandial levels of insulin, glucose, and AA. This allowed testing the hypothesis that aging impairs post-meal muscle protein anabolism, contributing to sarcopenia development. The older women were not sarcopenic, based on their relative appendicular muscle mass index, but displayed clear features of age-associated increase in adiposity. Despite this, they unexpectedly showed comparable protein anabolic responses and insulin sensitivity of glucose metabolism. The responses of skeletal muscle insulin signaling through the Akt/mTORC1 pathway were also unaltered and therefore consistent with the absence of insulin resistance and a similar stimulation of mixed-muscle protein synthesis by feeding. We attribute these sustained metabolic/anabolic responses with advancing age largely to the absence of concurrent diseases, sufficient energy and protein intake, and an active lifestyle.
Although insulin resistance is viewed as a possible cause of sarcopenia, such resistance may result more from an age-related increase in adiposity and inactivity than from chronological age (5,22–24). As changes in body composition are intrinsic to aging, their metabolic effects are difficult to distinguish from those of advancing age. Our elderly women’s lower total lean mass was attributable to their shorter stature, but total or %body fat and central adiposity were higher even when adjusted for height. Despite this, their insulin sensitivity of glucose metabolism, both hepatic and peripheral, was comparable with that of young women, consistent with our previous results obtained from the hyperinsulinemic, euglycemic, and isoaminoacidemic clamp, a response restricted to women (5). Although the prevailing view is that age impedes on insulin sensitivity, only half of the studies reported in (22) confirmed this. Furthermore, the small age effect found in the European Group for the Study of Insulin Resistance 1146-subject cohort (22) was attributed to changes in body composition. Furthermore, a sex difference in insulin sensitivity is supported by our (5) and others’ recent data (24,25), showing more impact of aging in men, which may be due to different changes in fat distribution (25).
The elderly women reached lower clamp insulin concentrations. Both groups received the same insulin infusion rates relative to LBM, which were one fourth the 40 mU/m2·min we used previously (5,16,17) because this clamp stimulates endogenous secretion (16). Thus, the lower serum insulin might reflect either a lesser endogenous response or higher clearance rate or both. The former is more likely since C-peptide concentrations also increased less.
Although total clamp AA infusion was less in the elderly women, their whole-body and muscle protein anabolic responses were similar to those of the young. Because the insulin response was less in older women and protein breakdown is suppressed by insulin in a dose-response manner (26), they required less exogenous AA to maintain the same hyperaminoacidemia as the young. The total AAs infused over 3 hours was 16 g in elderly and 22 g in young women, corresponding to 9 and 12 g of EAA (both p = .001). The amount of EAA received by the elderly women is very similar to the oral doses in other studies, 10 (10) and 7 g (14), reporting impairment of protein anabolism. These studies tested the isolated effect of AA drinks at basal (14) or peak insulin response ∼90 pmol/L (10). Thus, our greater hyperinsulinemia, including an endogenous response, exerted an additional effect on whole-body and muscle protein anabolism. The different insulin concentrations may explain the discrepant findings, suggesting that high physiological insulin is required to stimulate protein synthesis, when AA provision is not sufficient to exert its maximum effect.
Despite the lower insulin levels, phosphorylation of AktSer473 increased to the same extent as in the young. Such a similar increase was reported in young and elderly participants infused with insulin and AA, associated with impaired stimulation of muscle protein synthesis in the elderly women (15). Another study showed blunted inhibition of proteolysis attributed to reduced Akt activation in elderly participants with minimal elevation of insulin (9). These seemingly contradictory results may be reconciled by differences in the dose-dependent effects of insulin on protein breakdown.
Phosphorylation of FoxO3a by Akt prevents the expression of ubiquitin ligases involved in proteolysis (27) and may be a potential mechanism explaining insulin’s inhibition of protein breakdown. We found a similar increase in FoxO3aThr32 phosphorylation in both groups. However, we (16) and others (28) found no change in messenger RNA expression of muscle-specific ubiquitin ligases despite suppression of whole-body and muscle proteolysis, in response to a 2 hour-exposure to both insulin and AA. Thus, the role of FoxO in mediating acute postprandial regulation of proteolysis in humans may be independent of ubiquitin ligases and remains to be clarified.
Insulin stimulates protein synthesis in part by relieving PRAS40 suppression on mTOR signaling through Akt-mediated phosphorylation at Thr246 (29). PRAS40Thr246 phosphorylation increased to a similar extent as that of Akt during the clamp in both groups. The lack of defects in insulin signaling through the PI3K/Akt pathway reinforces the absence of insulin resistance in the studied elderly women. Signaling downstream of mTOR was evaluated by the phosphorylation of two targets of S6K1, rpS6, and IRS-1 and of 4E-BP1. Despite similar plasma branched chain-AA and leucine concentrations with lower infusion rates, elderly women had the same increase in rpS6 phosphorylation. Consistent phosphorylation of IRS-1 on Ser636/639, putative sites of negative feedback regulation by S6K1 (30), increased to a similar extent in both groups, suggesting that insulin and AA signaling downstream of mTOR was not impaired in the elderly women. Absence of differences in 4E-BP1Thr37/46 phosphorylation in skeletal muscle in response to postprandial and supraphysiological insulin in young and elderly participants was recently reported (8). Despite substantial activation of PI3K/Akt signaling in both groups, only minor increases in phosphorylation of 4E-BP1 at Ser65 and Thr70 occurred during the clamp, which although statistically significant, are unlikely to be physiologically relevant.
The physically active lifestyle of our elderly women is likely to be an important determinant of their maintenance of relative appendicular muscle mass and metabolic responses. Although similar between groups, the average physical activity level of 1.4–1.5 indicates only light to moderate activity, comparable with those of the Louisiana Healthy Aging Study, using the doubly labeled water technique (31). It also indicates that the young women spent the majority of their time in sedentary or light activities, thus acting as good controls, but may not be representative of generally more active young women. Without fitness programs or high-intensity exercises, our elderly women were fully independent in instrumental daily living activities and engaged in social activities involving some degree of physical activity and may thus represent an active cohort of successful aged women. Physical activity energy correlated with glucose Rd during clamp (r = .69, p = .009, controlled for LBM), confirming the impact of usual activity level on insulin sensitivity, but did not with protein turnover data. It is likely that exposure to postprandial AA levels had a predominant impact on protein anabolic responses, and because of similarities between groups, the range of responses (and sample size) may have been too narrow to identify a correlation with physical activity.
CONCLUSIONS
We found no aging effect on whole-body insulin sensitivity and protein anabolic responses to a simulated intravenous meal in elderly women displaying similar muscle mass index and level of physical activity as those of our young group. Increased phosphorylation of key steps of the insulin-nutrient sensing Akt/mTOR pathway was consistent with the stimulation of muscle protein synthesis by feeding, similar in both groups. Acknowledging that our results may not be applicable to aged men, they do suggest that sarcopenia may not be an inevitable consequence of aging in the absence of concurrent illnesses and maintenance of sufficient dietary intake and physical activity.
FUNDING
Funded by the Canadian Institutes of Health Research. S.C. and J.A.M. received salary awards, and E.D.B.G. a fellowship from “Fonds de la recherche en santé du Québec.”
Disclosure: None.
SUPPLEMENTARY MATERIAL
Supplementary material can be found at: http://biomed.gerontologyjournals.org/
Authors thank the study participants and Connie Nardollilo, Marie Lamarche, Ginette Sabourin, Daniel White, Donato Brunetti, and Evan Nitschmann for technical work, Chantal Lagacé, research nurse, and Errol B. Marliss for his consultation and critical appraisal of the manuscript.
References
Author notes
Both authors have contributed equally.
Decision Editor: Luigi Ferrucci, MD, PhD

